Control Chart: Choosing the type of chart
The Quality Toolbook >
Control Chart > Choosing the type of chart
When to use it | How to understand it |
Example | How to do it | Practical
variations
Choosing the type of control chart
A number of points may be taken into consideration when identifying the type
of Control Chart to use:
- Variables charts are useful for machine-based processes, for example in
measuring tool wear.
- Variables charts are more sensitive to change than Attributes charts,
but can be more difficult both in the identification of what to measure and also
in the actual measurement.
- Only use an Individuals (X) chart when few measurements are available
(e.g. when they are infrequent or are particularly costly. These charts are less
sensitive to change than the Averages (X-bar) chart. They can also have an
unusual (non-normal) distribution, in which case the Control Chart is not a
suitable tool (use a Line Graph instead).

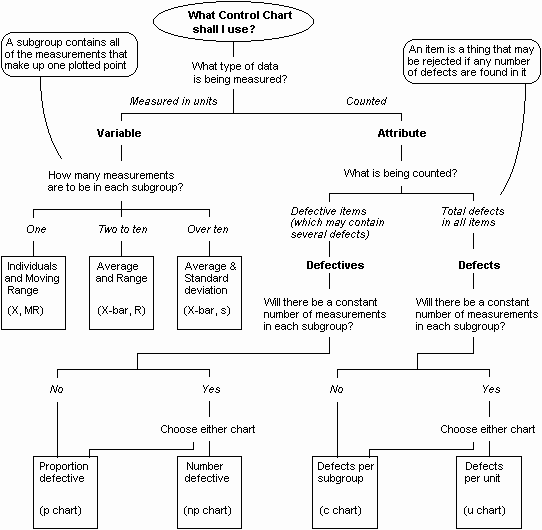
Fig. 1. Selecting the type of Control Chart
- The Standard Deviation (s) chart is easier to calculate if a statistical
calculator or computer spreadsheet is used. If one of these is available, then
the s-chart may be consistently used instead of the Range chart.
- Attribute charts are useful for both machine- and people-based processes.
Data for them is often readily available and they are easily understood. It can
thus be easier to start with these, then move on to Variables charts for more
detailed analysis.
- u- and c-charts give a measure of how defective units are (unlike p-
and np-charts).
- In a u-chart, the defects within the unit must be independent of one
another, for example, 'component failures on a printed circuit board'.
- Use a u-chart for continuous items, such as fabric. An example measure is
'defects per square meter of cloth'.
- A c-chart is a useful alternative to a u-chart when there are a lot of
possible defects on a unit, but there is only a small chance of any one defect
occurring. For example, 'flaws in a roll of material'.
|