The Psychology of Quality and More
|
|
The Psychology of Quality and More |
|
A Toolbook for Quality Improvement and Problem Solving (contents) |
NetworksThe Quality Toolbook > Tools for Applications > Tool types > Networks
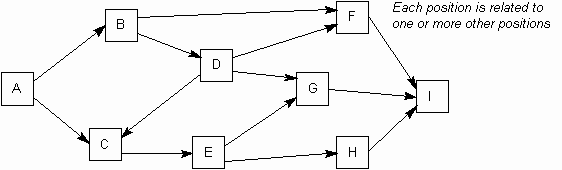
Non-numeric information often arrives in, or can be broken down into, discrete and relatively independent chunks. Visual tools help to discover and organize these chunks, showing the various types of relationships between them. DescriptionNetworks provide pictures of actual or conceptual systems, and are characterized by the way they show the relationship between individual elements of that system, as shown below. They also effectively appear where hierarchies become complex, with cross-links between individual elements. The relationship between network elements varies with the tool. For example, an Activity Network shows sequential relationship, whilst a Relations Diagram may show causal relationship. Networks usually show their elements (or nodes) within boxes, which may be shaped to indicate the element type. The box clearly delimits the node, visually separating it from other elements. The boxes are then connected with lines (or links or arcs). If there is directionality in the relationship, then this is commonly shown with arrowheads or other symbols on the lines. Lines can thus have a single arrowhead, be double-headed or have no arrow-head (non-directed).
Fig. 1. Nodes and links in a Network Examples
|
Site Menu |
|
Quality: | Quality Toolbook | Tools of the Trade | Improvement Encyclopedia | Quality Articles | Being Creative | Being Persuasive | |
|
And: | C Style (Book) | Stories | Articles | Bookstore | My Photos | About | Contact | |
|
Settings: | Computer layout | Mobile layout | Small font | Medium font | Large font | Translate | |
You can buy books here |
|
And the big |