Flow Process Chart: Practical variations
The Quality Toolbook >
Flow Process Chart > Practical variations
When to use it | How to understand it |
Example | How to do it | Practical
variations
<-- Previous |
Next
-->
Practical variations
- Point the transport arrow left or right to indicate direction of movement,
as in the illustration.
- Add information which will help the objective of using the chart. For example, if the objective is to improve efficiency, then add the time taken for each action next to the action symbol. Other information to add may include the distance traveled in a 'transport' action and the person(s) performing the action.
Use other tools, such as the String Diagram alongside it, to help gain a fuller understanding of the process.
- Make a video recording of the process, and then draw the chart from this. This makes it easier to stop and start the video in order to record actions, which makes it particularly useful for a process with rapid changes.
Other photographic tools include Micromotion Photography, which uses slow-motion film, and the Cyclegraph and Chronocyclegraph, which examine detailed hand movement by attaching a constant or intermittent light source to the hand and taking long exposure still photographs.
- An Outline Process Chart is an abbreviated form of Flow Process Chart, showing only the key actions (typically only operations, not transport, delays, etc.). It thus provides an overview, and can be useful for getting or giving a quick understanding of the process, especially if it is large.
- Use other symbols beyond the ASME symbols, for example to show actions specific to a given industry. Other common symbols are shown in
the table below.
Table 1. Additional symbols
|
Symbol |
Name |
Meaning |
 |
Combined operation |
Overlay symbols for actions which combine types. Put the main activity
outside. |
 |
Reject |
Rejection of item. Parentheses show percentage of items rejected. Line to
right lead to consequent action. |
 |
Differentiated operation |
Letter shows type of operation, e.g. C = clerical, M = machine, etc. |
 |
State change |
Description indicates change in state , for example a liquid cooling into
a solid. |
 |
Alternating process |
Down-arrow indicates one of several possible actions. This can show
alternative or simultaneous processes. |
-
When aiming to make a process more efficient, record the time
taken for each action, then improve those that take most time.
-
A Two-Handed Process Flow Chart individually shows the movement
of each hand in a manual process, as in Fig. 1. It is typically used when
analyzing a manual assembly process, to help make it easier to perform.
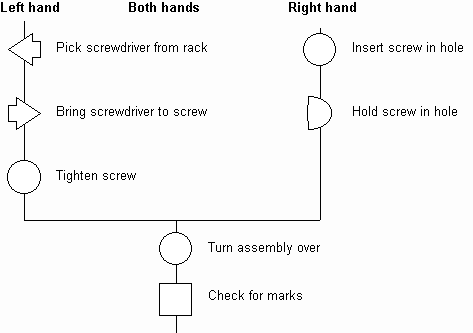
Fig. 1. Two-handed process flowchart
-
Describe a multi-person process in the same way as a Two-Handed
Flow Process Chart, with one vertical process line per person, showing
simultaneous actions at the same level, and bringing them together when people
work together on the same task.
-
Instead of drawing the symbols for each action, use one column
for each symbol and then mark the appropriate column. The change between
different actions can be highlighted by drawing lines between these marks, as in
Fig. 2.
A standard form of this is the OTIS Chart. where OTIS
stands for the four symbols: Operation, Transport, Inspection and Storage.
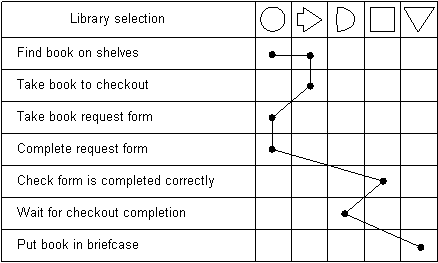
Fig. 2. Using columns for action types
<-- Previous |
Next
-->
|


